PKMF · CAMP REPORT 5 November 2022
A day of care. A life of service.
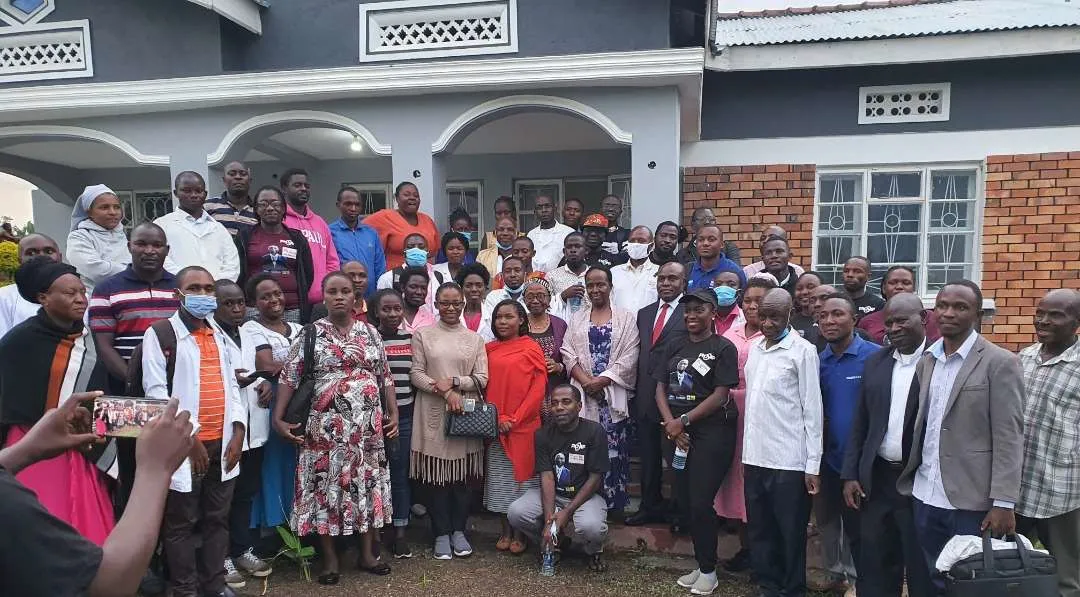
 Paddy Kabagambe
Nyakahya · 5 November 2022
Expanded report · September 2026 · Narrative, findings & statistical appendices
Use the Chapter menu or enter a page number to move directly to a section. The complete edition can also be read continuously or printed.
| Section | Page |
|---|---|
| Executive summary | 4 |
| 01 · Purpose | 5 |
| 02 · The day in numbers | 6 |
| 03 · Services | 7 |
| 04 · People behind the camp | 11 |
| 05 · Screening findings | 14 |
| 06 · Delivery and learning | 16 |
| 07 · Beyond the day | 18 |
| About this report | 19 |
| Statistical appendices | 20 |
| Section | Page |
|---|---|
| Attendance tables | 22 |
| Detailed screening tables | 24 |
| References & conclusion | 40 |
The inaugural camp brought consultations, screening, medicines, education and referral support to Nyakahya on 5 November 2022. The attendance register counted 641 people. The screening analysis reported 500 blood pressure records and 493 blood sugar readings; these overlapping service counts must not be added together.
The central operational lesson was the value of mobilisation and shared clinical effort. The central continuity-of-care recommendation was stronger prevention, awareness and treatment support for non-communicable diseases.
This expanded edition presents the narrative and aggregate tables from the supplied draft, including its limitations. Missing blood-donation totals, inconsistent team counts and the selected combined-BP analysis remain explicitly unresolved. There is no underlying patient register with which to reconstruct them.
2022 report, overview, findings and lessons.
The inaugural Paddy Kabagambe Memorial Medical Camp took place on Saturday, 5 November 2022, from 9 a.m. to 4.30 p.m. at Nyakahya Church of Uganda in Bwera, Kasese District.
Under the Paddy Kabagambe Memorial Foundation, family and friends organised the camp in memory of his generosity, kindness and commitment to the people of Bwera, Kasese and Uganda.
The theme was “Raising NCD awareness, treatment and prevention in Bwera, Kasese District”. Screening and care focused on hypertension and diabetes, alongside other outpatient services.
2022 camp report, introduction, theme, venue and date.
The report records 641 unique attendees: 238 male, 371 female and 32 with sex not documented in its attendance table. The draft’s 61% female figure corresponds approximately to the 609 sex-recorded attendees; women and girls were 57.9% of all 641 registrations. There were 135 children aged 0–15.
Screening records and attendance are different measures. The report describes 795 readings before deduplication, 555 unique screening records, 500 blood pressure records and 493 unique random blood sugar readings.
2022 report, summary of results. Screening records overlap and must not be summed as people.
The service package included blood pressure checks, random blood sugar checks, clinical consultation, laboratory rapid testing, medicines, blood donation, minor treatment and referrals for more advanced care.
Registration, triage, screening, results, consultation and pharmacy teams organised the client journey. Medical records, laboratory, blood transfusion and emergency-response teams supported the work.
Dr. Lawrence Baluku delivered a health talk on disease prevention. Volunteers also supported ushering, security, cleaning, crowd management, meals and refreshments.
2022 report, service package and teams.
Registration and medical-records teams documented arrivals and care. Triage included weight and height; separate stations handled blood pressure, random blood sugar and laboratory rapid testing. Results teams supported the movement from screening to clinical consultation.
Pharmacy and dispensing, blood transfusion, health education, and first aid and emergency response were also listed in the service organisation. The support team covered ushering, security, cleaning, crowd management, meals and refreshments.
The report describes Dr. Lawrence Baluku’s health talk as covering high blood pressure, diabetes, cancer and Ebola, with emphasis on prevention and lifestyle and behavioural change. This is the recorded scope of the talk, not a verbatim transcript.
2022 report, Service Package and Teams.
The report lists random blood sugar, HIV and malaria among laboratory tests. It does not provide separate totals or results for HIV and malaria; those cannot be inferred from attendance.
Medicines were purchased and supplied in kind. The source lists antihypertensive and antidiabetic medicines, deworming treatment, analgesics, antibiotics, antacids and nutritional supplements among the items dispensed. Quantities, stock balances and expenditure are not reported as an audited account.
Known hypertensive patients received medicine refills. Newly identified clients were linked to Bwera Hospital for repeat blood pressure measurement and decisions about ongoing treatment. Referral completion and later clinical outcomes are not quantified in the report.
2022 report, laboratory tests, drugs dispensed and follow-up. This is a historical service account, not prescribing guidance.
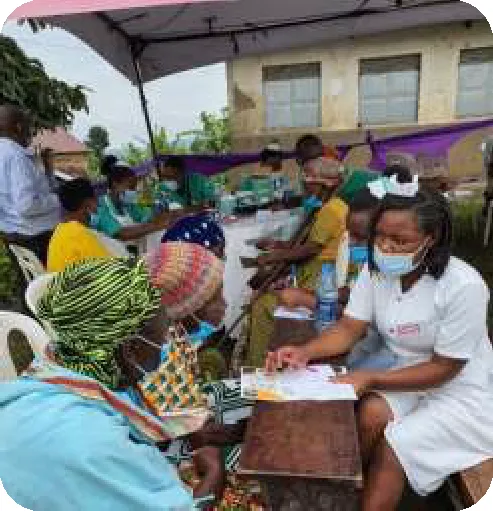
2022 camp report photograph.
The report thanks PKMF President Dr. Rose Muhindo Lukaaya, chief guest Hon. Dr. Crispus Kiyonga, the organising committee, local leaders, the District Health Officer, relatives, friends and well-wishers.
Health workers were mobilised from Bwera Hospital, Kasanga PHC, Bwera Nursing School, Bishop Masereka Medical Centre and Mbarara Regional Referral Hospital, as well as through family and professional networks.
The report describes a team of 50 health workers and support providers. Its listed role counts total 46; the overall figure is retained as a reported total, with the breakdown awaiting reconciliation.
2022 report, appreciation and summary of results; role-count reconciliation remains outstanding.
The listed professional and support roles add to 46, whereas the narrative states a total team of 50. The four-person difference cannot be allocated to a role from the supplied record. The table preserves the reported breakdown.
| Role | Reported number |
|---|---|
| Physicians | 4 |
| Nurses | 15 |
| Laboratory staff | 2 |
| Pharmacy dispensers | 2 |
| Lay providers | 23 |
| Sum of listed roles | 46 |
| Narrative team total | 50 |
2022 report, Summary of Results.
Nyakahya Parish Church’s clergy, local authorities, security personnel and community supporters helped make the day possible. Mbarara University of Science and Technology students and the Uganda Blood Transfusion Service in Kasese also contributed.
The report names Olive Pharmacy, Denk Pharmaceuticals, Centaur Pharmaceuticals, Mega Pharmaceuticals and Rwebikoona Pharmacy among pharmaceutical supporters. Medicines were both procured and donated in kind.
Financial, practical and moral support came together in a day that gave community members access to consultation and screening.
2022 report, greetings and appreciation.
The report records 500 blood pressure entries. It notes that 55 young children in the screening dataset did not have blood pressure measured because paediatric cuffs were unavailable.
The report analysed systolic and diastolic readings separately, then described a selected subset whose two readings fell in matching categories. Its combined table contains 204 records, while a related heading says 240.
These different denominators and the selected subset limit interpretation. The digital edition does not present those category percentages as the prevalence of hypertension in the wider Bwera community.
The report records individual and group education, medicine refills for people with known hypertension, and links to Bwera Hospital for further assessment and treatment.
2022 report, blood pressure analysis and combined table. Source denominator inconsistency retained here as a limitation.
The source groups 493 unique random blood sugar readings as shown below. These are the report’s historical screening categories; they do not establish a diagnosis for an individual.
| Source category | Readings |
|---|---|
| Low | 4 |
| Normal | 442 |
| “Pre-diabetes” | 29 |
| High | 18 |
| Total | 493 |
2022 report, random blood sugar table. Source category wording preserved in quotation marks where applicable.
The report records clearance through the District Health Officer and infection-prevention arrangements during the 2022 Ebola outbreak and COVID-19 period. It states that no presumptive Ebola case was identified at the camp.
Radio, brochures and word of mouth helped mobilise the community. The report identifies teamwork, timekeeping, favourable weather and access to specialist consultation at no cost as strengths.
Blood donation took place, but the source leaves the number of units as “XX”. This edition therefore makes no numerical claim for blood collected.
2022 report, summary, blood transfusion and what worked well. Reviewer comments also flag the missing blood donation total.
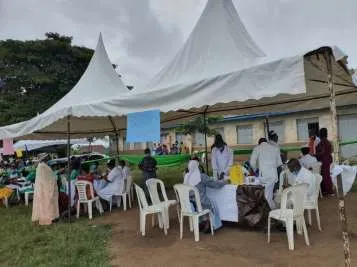
2022 camp report photograph.
The report called for sustained public-health activity around non-communicable diseases, linking awareness and prevention with treatment and continuing support.
It proposed public lectures, radio discussions and campaigns spanning health, education and socioeconomic empowerment. These were recommendations for future work, rather than a record of services already delivered.
The following year’s memorial lecture at Karambi became another expression of Paddy’s commitment to community service.
2022 report, lessons and recommendations; foundation event record for the 2023 lecture.
This is an illustrated reading edition of PKMF Medical Camp Report, supplied as a draft with tracked changes and reviewer comments dated 5 January 2023. The report credits Dr. Mbusa Kabagambe Patrick, Birungi Charles and Boaz Tumusiime.
The text has been reorganised for reading, with original event photographs. Editorial comments are treated as review notes, not as new event facts. Outstanding totals and denominator inconsistencies are identified in the relevant pages.
The original clinical analysis cites Chobanian and colleagues, JAMA 2003, on blood pressure classification, and Lunyera and colleagues, PLOS ONE 2018, on hypertension in Uganda. The website reports the historical event and does not reproduce its population-prevalence comparison as an established finding.
Family-supplied report and embedded photographs. Digital edition, September 2026.
The following tables preserve the supplied draft’s aggregate data. Counts and percentages are separated; percentages are the source’s rounded values. Age-specific results are split into narrower tables for legibility. ND means not documented.
Blood pressure categories reflect the draft’s historical scheme, not a current clinical protocol. Children occur in the tables; adult category labels should not be treated as paediatric diagnoses. The combined-BP subset includes only matching systolic/diastolic categories and excludes other measured clients.
The source threshold table uses ≥180 and ≥110 for the highest grades, while later tables print >180 and >110. This inconsistency is retained for transparency and requires the original register for resolution.
2022 report, methods and statistical tables.
| Source category | Systolic | Diastolic |
|---|---|---|
| Hypotension | <90 | <60 |
| Normal | 90-119 | 60-79 |
| Pre-hypertension | 120-139 | 80-89 |
| Grade I Hypertension | 140-159 | 90-99 |
| Grade II Hypertension | 160-179 | 100-109 |
| Grade III Hypertension | ≥180 | ≥110 |
Historical source table; blood pressure values in mmHg. This is not a treatment guide.
Columns are male, female, sex not documented, and total. The female percentage in the narrative uses a different denominator from all registrations.
| Age | Male | Female | ND | Total |
|---|---|---|---|---|
| <5 | 19 | 20 | 4 | 43 |
| 5-15 | 36 | 50 | 6 | 92 |
| 16-25 | 17 | 26 | 1 | 44 |
| 26-35 | 22 | 39 | 2 | 63 |
| 36-45 | 27 | 50 | 5 | 82 |
| 46-55 | 32 | 58 | 2 | 92 |
2022 report, age and sex distribution; column interpretation follows the source totals and headings.
Columns are male, female, sex not documented, and total. The female percentage in the narrative uses a different denominator from all registrations.
| Age | Male | Female | ND | Total |
|---|---|---|---|---|
| 56-65 | 31 | 43 | 6 | 80 |
| 66-75 | 17 | 32 | 3 | 52 |
| >75 | 8 | 26 | 3 | 37 |
| ND | 29 | 27 | 0 | 56 |
| TOTAL | 238 | 371 | 32 | 641 |
2022 report, age and sex distribution; column interpretation follows the source totals and headings.
Source values by age in years. These describe recorded attendees, not disease prevalence in Bwera.
| Category | 5–15 | 16–25 | 26–35 | 36–45 |
|---|---|---|---|---|
| Hypotension | 0 | 0 | 2 | 0 |
| Normal | 5 | 18 | 36 | 22 |
| Pre-hypertension | 2 | 24 | 31 | 31 |
| Grade 1 Hypertension | 1 | 5 | 7 | 18 |
| Grade 2 Hypertension | 0 | 1 | 0 | 8 |
| Grade 3 Hypertension | 0 | 0 | 0 | 2 |
| TOTAL | 8 | 48 | 76 | 81 |
2022 report aggregate tables. Source rounding retained. Category thresholds appear in the classification and blood-sugar pages.
Source values by age in years. These describe recorded attendees, not disease prevalence in Bwera.
| Category | 46–55 | 56–65 | 66–75 | >75 | Total |
|---|---|---|---|---|---|
| Hypotension | 0 | 1 | 0 | 0 | 3 |
| Normal | 19 | 9 | 6 | 2 | 117 |
| Pre-hypertension | 39 | 32 | 15 | 4 | 178 |
| Grade 1 Hypertension | 19 | 26 | 21 | 18 | 115 |
| Grade 2 Hypertension | 7 | 14 | 10 | 8 | 48 |
| Grade 3 Hypertension | 9 | 11 | 9 | 8 | 39 |
| TOTAL | 93 | 93 | 61 | 40 | 500 |
2022 report aggregate tables. Source rounding retained. Category thresholds appear in the classification and blood-sugar pages.
Source values by age in years. These describe recorded attendees, not disease prevalence in Bwera.
| Category | 5–15 | 16–25 | 26–35 | 36–45 |
|---|---|---|---|---|
| Hypotension | 0% | 0% | 3% | 0% |
| Normal | 63% | 38% | 47% | 27% |
| Pre-hypertension | 25% | 50% | 41% | 38% |
| Grade 1 Hypertension | 13% | 10% | 9% | 22% |
| Grade 2 Hypertension | 0% | 2% | 0% | 10% |
| Grade 3 Hypertension | 0% | 0% | 0% | 2% |
| TOTAL | 100% | 100% | 100% | 100% |
2022 report aggregate tables. Source rounding retained. Category thresholds appear in the classification and blood-sugar pages.
Source values by age in years. These describe recorded attendees, not disease prevalence in Bwera.
| Category | 46–55 | 56–65 | 66–75 | >75 | Total |
|---|---|---|---|---|---|
| Hypotension | 0% | 1% | 0% | 0% | 1% |
| Normal | 20% | 10% | 10% | 5% | 23% |
| Pre-hypertension | 42% | 34% | 25% | 10% | 36% |
| Grade 1 Hypertension | 20% | 28% | 34% | 45% | 23% |
| Grade 2 Hypertension | 8% | 15% | 16% | 20% | 10% |
| Grade 3 Hypertension | 10% | 12% | 15% | 20% | 8% |
| TOTAL | 100% | 100% | 100% | 100% | 100% |
2022 report aggregate tables. Source rounding retained. Category thresholds appear in the classification and blood-sugar pages.
Source values by age in years. These describe recorded attendees, not disease prevalence in Bwera.
| Category | 5–15 | 16–25 | 26–35 | 36–45 |
|---|---|---|---|---|
| Hypotension | 0 | 4 | 2 | 2 |
| Normal | 2 | 22 | 41 | 26 |
| Pre-hypertension | 4 | 11 | 26 | 31 |
| Grade 1 Hypertension | 2 | 9 | 3 | 12 |
| Grade 2 Hypertension | 0 | 1 | 3 | 7 |
| Grade 3 Hypertension | 0 | 1 | 1 | 3 |
| TOTAL | 8 | 48 | 76 | 81 |
2022 report aggregate tables. Source rounding retained. Category thresholds appear in the classification and blood-sugar pages.
Source values by age in years. These describe recorded attendees, not disease prevalence in Bwera.
| Category | 46–55 | 56–65 | 66–75 | >75 | Total |
|---|---|---|---|---|---|
| Hypotension | 2 | 1 | 2 | 0 | 13 |
| Normal | 29 | 19 | 9 | 7 | 155 |
| Pre-hypertension | 19 | 38 | 10 | 15 | 154 |
| Grade 1 Hypertension | 21 | 23 | 16 | 11 | 97 |
| Grade 2 Hypertension | 12 | 9 | 11 | 6 | 49 |
| Grade 3 Hypertension | 10 | 3 | 13 | 1 | 32 |
| TOTAL | 93 | 93 | 61 | 40 | 500 |
2022 report aggregate tables. Source rounding retained. Category thresholds appear in the classification and blood-sugar pages.
Source values by age in years. These describe recorded attendees, not disease prevalence in Bwera.
| Category | 5–15 | 16–25 | 26–35 | 36–45 |
|---|---|---|---|---|
| Hypotension | 0% | 8% | 3% | 2% |
| Normal | 25% | 46% | 54% | 32% |
| Pre-hypertension | 50% | 23% | 34% | 38% |
| Grade 1 Hypertension | 25% | 19% | 4% | 15% |
| Grade 2 Hypertension | 0% | 2% | 4% | 9% |
| Grade 3 Hypertension | 0% | 2% | 1% | 4% |
| TOTAL | 100% | 100% | 100% | 100% |
2022 report aggregate tables. Source rounding retained. Category thresholds appear in the classification and blood-sugar pages.
Source values by age in years. These describe recorded attendees, not disease prevalence in Bwera.
| Category | 46–55 | 56–65 | 66–75 | >75 | Total |
|---|---|---|---|---|---|
| Hypotension | 2% | 1% | 3% | 0% | 3% |
| Normal | 31% | 20% | 15% | 18% | 31% |
| Pre-hypertension | 20% | 41% | 16% | 38% | 31% |
| Grade 1 Hypertension | 23% | 25% | 26% | 28% | 19% |
| Grade 2 Hypertension | 13% | 10% | 18% | 15% | 10% |
| Grade 3 Hypertension | 11% | 3% | 21% | 3% | 6% |
| TOTAL | 100% | 100% | 100% | 100% | 100% |
2022 report aggregate tables. Source rounding retained. Category thresholds appear in the classification and blood-sugar pages.
Source values by age in years. Selected matching-category subset only; table total 204, conflicting source heading 240. Not population prevalence.
| Category | 5–15 | 16–25 | 26–35 | 36–45 |
|---|---|---|---|---|
| Hypotension | 0 | 0 | 0 | 0 |
| Normal | 2 | 9 | 26 | 12 |
| Pre-hypertension | 2 | 7 | 16 | 14 |
| Grade 1 Hypertension | 0 | 1 | 1 | 4 |
| Grade 2 Hypertension | 0 | 0 | 0 | 4 |
| Grade 3 Hypertension | 0 | 0 | 0 | 1 |
| TOTAL | 4 | 17 | 43 | 35 |
2022 report aggregate tables. Source rounding retained. Category thresholds appear in the classification and blood-sugar pages.
Source values by age in years. Selected matching-category subset only; table total 204, conflicting source heading 240. Not population prevalence.
| Category | 46–55 | 56–65 | 66–75 | >75 | Total |
|---|---|---|---|---|---|
| Hypotension | 0 | 0 | 0 | 0 | 0 |
| Normal | 13 | 2 | 3 | 2 | 69 |
| Pre-hypertension | 13 | 14 | 5 | 0 | 71 |
| Grade 1 Hypertension | 8 | 8 | 11 | 4 | 37 |
| Grade 2 Hypertension | 3 | 4 | 3 | 0 | 14 |
| Grade 3 Hypertension | 5 | 3 | 3 | 1 | 13 |
| TOTAL | 42 | 31 | 25 | 7 | 204 |
2022 report aggregate tables. Source rounding retained. Category thresholds appear in the classification and blood-sugar pages.
Source values by age in years. Selected matching-category subset only; table total 204, conflicting source heading 240. Not population prevalence.
| Category | 5–15 | 16–25 | 26–35 | 36–45 |
|---|---|---|---|---|
| Hypotension | 0% | 0% | 0% | 0% |
| Normal | 50% | 53% | 60% | 34% |
| Pre-hypertension | 50% | 41% | 37% | 40% |
| Grade 1 Hypertension | 0% | 6% | 2% | 11% |
| Grade 2 Hypertension | 0% | 0% | 0% | 11% |
| Grade 3 Hypertension | 0% | 0% | 0% | 3% |
| TOTAL | 100% | 100% | 100% | 100% |
2022 report aggregate tables. Source rounding retained. Category thresholds appear in the classification and blood-sugar pages.
Source values by age in years. Selected matching-category subset only; table total 204, conflicting source heading 240. Not population prevalence.
| Category | 46–55 | 56–65 | 66–75 | >75 | Total |
|---|---|---|---|---|---|
| Hypotension | 0% | 0% | 0% | 0% | 0% |
| Normal | 31% | 6% | 12% | 29% | 34% |
| Pre-hypertension | 31% | 45% | 20% | 0% | 35% |
| Grade 1 Hypertension | 19% | 26% | 44% | 57% | 18% |
| Grade 2 Hypertension | 7% | 13% | 12% | 0% | 7% |
| Grade 3 Hypertension | 12% | 10% | 12% | 14% | 6% |
| TOTAL | 100% | 100% | 100% | 100% | 100% |
2022 report aggregate tables. Source rounding retained. Category thresholds appear in the classification and blood-sugar pages.
Source values by age in years. These describe recorded attendees, not disease prevalence in Bwera.
| Category | 5–15 | 16–25 | 26–35 | 36–45 |
|---|---|---|---|---|
| Hypoglycemia | 0 | 0 | 0 | 2 |
| Normal | 8 | 46 | 70 | 71 |
| Pre-diabetes | 0 | 0 | 4 | 5 |
| Hyperglycemia | 0 | 1 | 1 | 2 |
| TOTAL | 8 | 47 | 75 | 80 |
2022 report aggregate tables. Source rounding retained. Category thresholds appear in the classification and blood-sugar pages.
Source values by age in years. These describe recorded attendees, not disease prevalence in Bwera.
| Category | 46–55 | 56–65 | 66–75 | >75 | Total |
|---|---|---|---|---|---|
| Hypoglycemia | 0 | 1 | 1 | 0 | 4 |
| Normal | 79 | 87 | 50 | 31 | 442 |
| Pre-diabetes | 5 | 5 | 7 | 3 | 29 |
| Hyperglycemia | 7 | 0 | 3 | 4 | 18 |
| TOTAL | 91 | 93 | 61 | 38 | 493 |
2022 report aggregate tables. Source rounding retained. Category thresholds appear in the classification and blood-sugar pages.
Source values by age in years. These describe recorded attendees, not disease prevalence in Bwera.
| Category | 5–15 | 16–25 | 26–35 | 36–45 |
|---|---|---|---|---|
| Hypoglycemia | 0% | 0% | 0% | 3% |
| Normal | 100% | 98% | 93% | 89% |
| Pre-diabetes | 0% | 0% | 5% | 6% |
| Hyperglycemia | 0% | 2% | 1% | 3% |
| TOTAL | 100% | 100% | 100% | 100% |
2022 report aggregate tables. Source rounding retained. Category thresholds appear in the classification and blood-sugar pages.
Source values by age in years. These describe recorded attendees, not disease prevalence in Bwera.
| Category | 46–55 | 56–65 | 66–75 | >75 | Total |
|---|---|---|---|---|---|
| Hypoglycemia | 0% | 1% | 2% | 0% | 1% |
| Normal | 87% | 94% | 82% | 82% | 90% |
| Pre-diabetes | 5% | 5% | 11% | 8% | 6% |
| Hyperglycemia | 8% | 0% | 5% | 11% | 4% |
| TOTAL | 100% | 100% | 100% | 100% | 100% |
2022 report aggregate tables. Source rounding retained. Category thresholds appear in the classification and blood-sugar pages.
The original report cites Chobanian and colleagues, The Seventh Report of the Joint National Committee on Prevention, Detection, Evaluation, and Treatment of High Blood Pressure, JAMA (2003), DOI 10.1001/jama.289.19.2560.
It also cites Lunyera and colleagues, Geographic differences in the prevalence of hypertension in Uganda: Results of a national epidemiological study, PLOS ONE (2018), DOI 10.1371/journal.pone.0201001. These are the draft’s references, not a claim that the camp’s selected sample supports a direct national comparison.
The camp demonstrated a shared willingness to bring services closer to Bwera. Its next step, as recommended by the organisers, is sustained awareness and support for continuing care. The report documents the day and its lessons; it does not claim completed follow-up, an audited financial total or a resolved blood-donation count.
Report by Dr. Mbusa Kabagambe Patrick, Birungi Charles and Boaz Tumusiime; supplied tracked draft, 5 January 2023.
Use arrows, your keyboard or swipe to turn the page.
An illustrated reading edition of the supplied camp report. Source notes identify the record and its limitations.
You’re offline. Reading the saved edition.